Make data-driven decisions about solar, battery storage, and electricity tariffs
Analyze quarter-hourly load data and electricity bills. Compare solar and storage potential, peak shaving, electricity contracts, and demand charges in one transparent workflow.
Choose your data basis
Every analysis is based on a commercial load profile. Upload your site's quarter-hourly load curve as a CSV or start with a measured, anonymized profile from a real company.
Plan solar and storage
for your site
Compare investment options for new or existing commercial sites using measured load data.
- Evaluate solar and storage sizes together
- Separate energy and demand-cost effects
- Assess cash flows, payback, and technical limits
Slide 1 of 3: Load profile and solar generation across the year
Use left and right arrow keys to change slides.

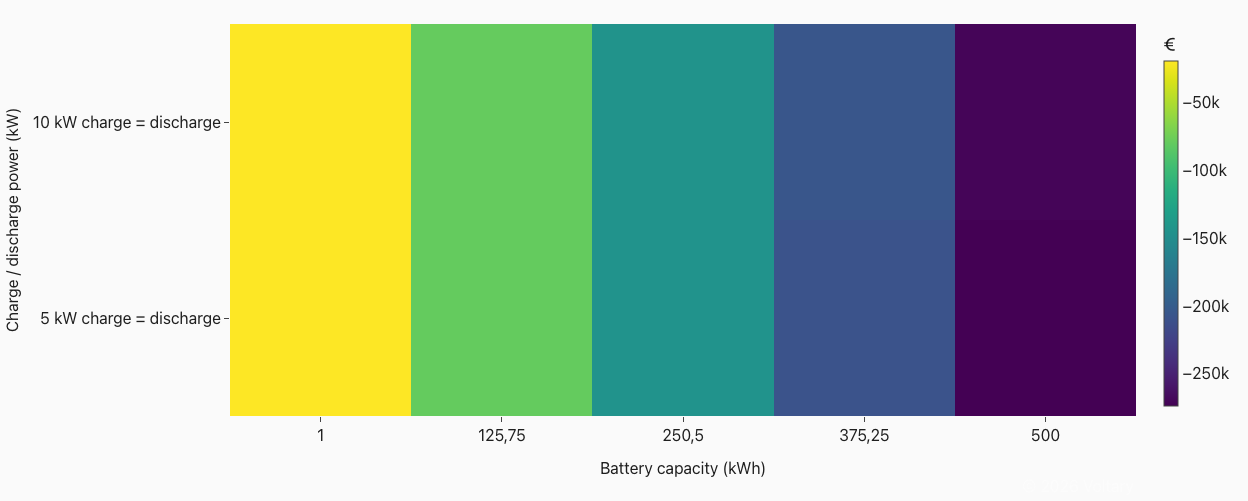
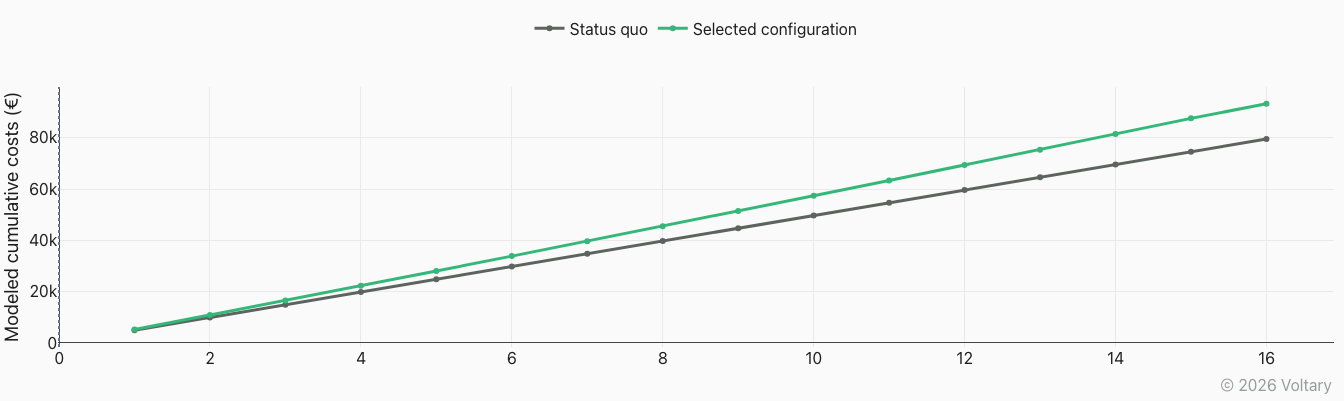
Load profile and solar generation across the year
Reduce demand peaks
with suitable battery power
Identify billing-relevant peaks and assess the power and energy a battery would need to provide.
- Identify annual maximum demand and peak events
- Model demand charges realistically
- Compare peak-shaving targets technically and financially
Slide 1 of 3: Demand peaks across the year
Use left and right arrow keys to change slides.

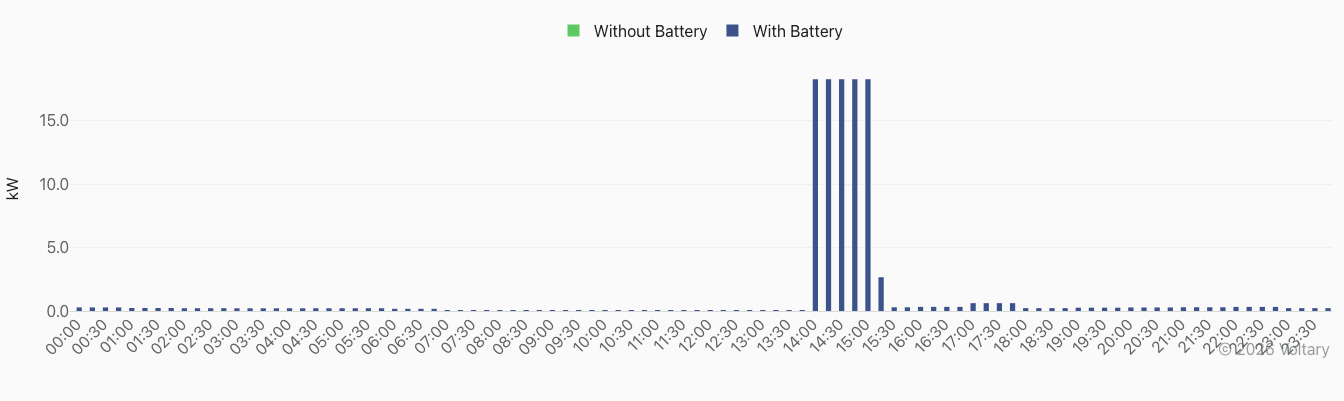
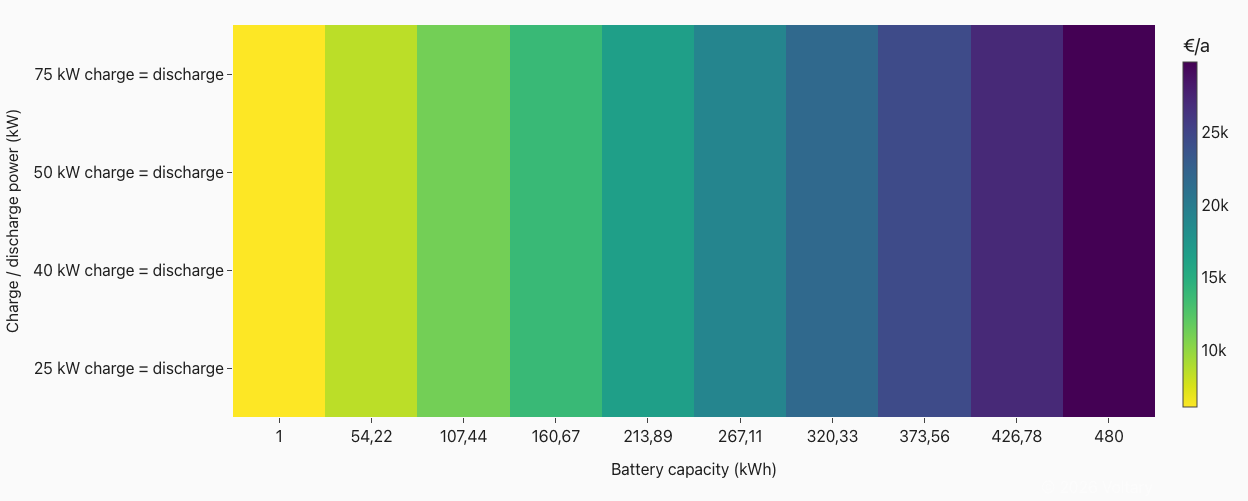
Demand peaks across the year
Compare electricity tariffs
on the same data basis
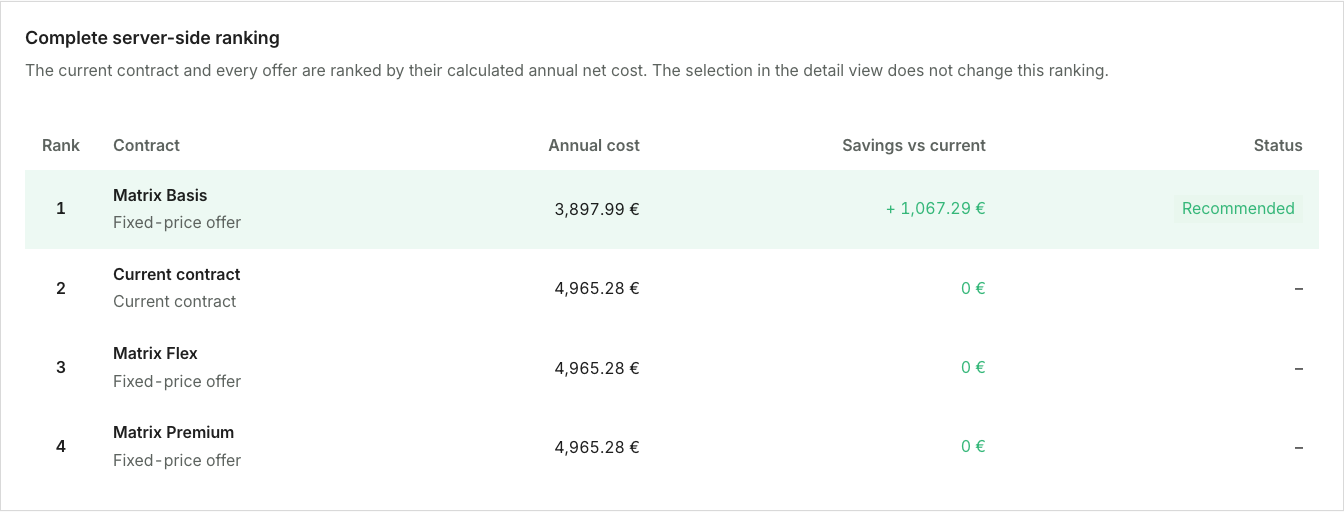
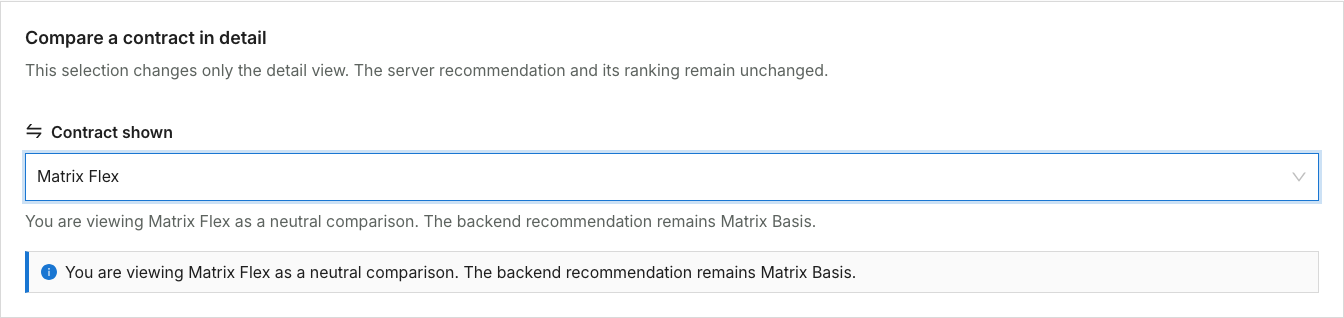
Reproduce the current contract and compare alternative offers against the same unchanged load profile.
- Separate supply, grid, and demand costs
- Compare offers net of VAT on the same data basis
- Request suitable suppliers or individual offers
Slide 1 of 3: Cost blocks in the current electricity contract
Use left and right arrow keys to change slides.

Cost blocks in the current electricity contract
Beta version: feedback welcome
Voltary is still in beta. Some bugs, unexpected visual issues, or occasional delays may occur. Because our calculations are computationally intensive, things can take a little longer, especially when demand is high. Your feedback helps us keep developing Voltary in a focused way.